Automattic
Making the web a better placeAutomattic Celebrates Graduates of University of Illinois Chicago’s AI Leaders Program
23 Jun 2026, 4:00 pm
On June 23, around 40 students from Illinois and Louisiana will wrap up the year at University of Illinois Chicago (UIC) as the first graduating cohort of AI Leaders—the nation’s first workforce-focused AI literacy course tied to a recognized credential.
These students built real WordPress projects. They applied generative AI to real work. For example, Stephen Poole completed the Ultimate Success track and posted a reflection after every session, and shipped his portfolio at stefanpoole.dev. Another student, Sharaheel Ali, finished WordPress 1–8 and launched sharali.blog, framing his portfolio around WordPress support engineering, cybersecurity, and AI. They earned a micro-credential backed by UIC and the WordPress Foundation. And those who completed the course also earned $1,000. Automattic is proud that we joined the University of Illinois Chicago (UIC) to make a donation to UIC Tech Solutions Open Source Fund earlier this year.
Built on Open Source
AI Leaders works because it’s built on open source. Students learn on WordPress, which powers more than 40% of the web, and contribute back to it. They use generative AI as a tool and leave with a credential employers can verify. The community they build while contributing to WordPress remains long after graduation.
At Automattic, we believe deeply in open source; it’s the ethos that built the web. We think it should help build the next generation of AI-literate workers too—in the open, accessible to all, and with full ownership of the work they do.
Bigger Things are on the Horizon
AI Leaders is just one piece of Automattic’s broader investment in education. We’ve pledged $500 million worth of hosting accounts over the next five years to support open source learning, workforce development, and the next generation of contributors to the web.
We’re investing in this because access to AI and open source skills shouldn’t depend on where you live or what you can afford. The first cohort proves the model works. Now we want to help it grow
What’s Next
Prospective employers and agencies will attend a graduation party in Chicago to meet the students, and more job placements are in motion. The next round of AI Leaders is on the horizon; we’ll share application details for that soon. And to the inaugural AI Leaders cohort: congratulations. The web is what we make it, and we’re excited to watch you shape that legacy.
Automattic Joins the Tech Coalition
1 Jun 2026, 1:00 pm
Automattic was built on the belief that publishing should be open and accessible to everyone. That mission only means something if the spaces where people create, connect, and share are also safe—especially for kids. Today, we’re proud to announce that Automattic has joined the Tech Coalition, a global alliance of technology companies working together to combat online child sexual exploitation and abuse (OCSEA).
The Tech Coalition brings together more than 60 companies (including Meta, Google, Microsoft, Apple, and Snap) to develop safer products, share threat intelligence, and support research that no single company could drive on its own. Members collaborate on detection technology, cross-platform signal sharing through programs like Lantern, and transparency standards that raise the bar across the industry.
Child safety is something we’ve thought deeply about and care deeply about across our platforms, from Tumblr to WordPress.com. But protecting kids online isn’t something any one company can solve alone. Joining the Tech Coalition helps us expand beyond what we can accomplish within our own walls, and allows us to contribute to something larger alongside people who share that commitment.
An open web requires its stewards to lead on safety. That starts with us.

Pressable, WordPress VIP, and WP Cloud Partners Earn Secure Hosting Alliance Certification
28 May 2026, 1:00 pm

We’re proud to share that Pressable and WordPress VIP have each earned official certification from the Secure Hosting Alliance (SHA), an i2Coalition initiative that recognizes hosting providers with a genuine, demonstrable commitment to security, reliability, and responsible operations. At the same time, through WP Cloud’s sponsorship of the SHA, several WP Cloud partners have earned certification of their own.
What the SHA Evaluates
Certification from the SHA Trust Seal Program requires providers to demonstrate operational standards across four areas:
- Transparent customer-facing policies
- Documented infrastructure misuse protocols with prioritized abuse response
- Proactive network reliability and recovery planning
- Lawful handling of government and law enforcement data requests
These principles represent the day-to-day discipline that separates hosting built for trust from hosting built for price.
Pressable: Built for Agencies, Certified for Trust
For the agencies and high-growth businesses building on Pressable, this certification provides independent, third-party verification of what our customers already expect: fast abuse response, transparent communication, and infrastructure engineered for real-world traffic demands.
“Most hosting providers compete primarily on what they charge. SHA is about what they’re willing to be accountable for,” Vik Patel, general manager of Pressable explains, “For the agencies and businesses building on Pressable, this certification means their infrastructure has been independently reviewed and held to a documented standard. That’s the kind of assurance serious operators actually want.”
WordPress VIP: Enterprise-Grade Security, Formally Recognized
WordPress VIP serves some of the world’s largest publishers, brands, and governments. At that scale, security, abuse response, and lawful data handling are baseline requirements. SHA certification reflects the operational rigor that VIP’s enterprise customers already demand.
“Running infrastructure for enterprise clients like NASA means treating security, abuse response, and lawful data handling as core obligations every day,” says Steph Yiu, CEO, WordPress VIP. “SHA’s standards align with what our enterprise customers already require of us, and earning the accreditation reflects the operational work behind that — work that usually doesn’t get recognized publicly.”
WP Cloud: Extending High Standards Across the Ecosystem
SHA accreditation has historically been most accessible to the largest, best-resourced hosting providers. Through WP Cloud, Automattic is changing that. As an official SHA sponsor, WP Cloud is covering the cost of accreditation for its partner ecosystem, putting the same trust seal within reach of independent hosts, agencies, and specialty providers who are already doing the work.
“The Secure Hosting Alliance is one of the most credible efforts I’ve seen to name and elevate the hosts who are doing this the right way,” says Jesse Friedman, Head of WP Cloud, Automattic “We didn’t want SHA accreditation to be something only the largest providers could afford.”
Several WP Cloud partners have already earned certification: Convesio, a containerized WordPress host with a WooCommerce focus; Ivapix, built for agencies and multi-site operators; and Infinite Source, which combines development and hosting under one roof.
A Healthier Web Starts With Accountable Infrastructure
Hosting providers don’t just sell servers; we provide the foundation that businesses, journalists, nonprofits, and creators rely on to reach the world. The Secure Hosting Alliance represents the industry choosing to hold itself to a higher standard, and we’re glad to have Pressable, WordPress VIP, and a growing cohort of WP Cloud partners standing on the right side of that line.
To learn more about the SHA Trust Seal Program, visit hostingsecurity.net. WP Cloud partners interested in starting their SHA accreditation can get in touch.
Where Automattic Meets Up
7 May 2026, 3:50 pm
Sharing Where We Stay
Automattic is fully distributed, with no headquarters. A few times a year, teams meet in person at places like a villa in Tuscany, a beach house on the Outer Banks, or a cabin outside Boulder.
Over time, we’ve built a valuable list of team-tested retreat spots: places that work for fifteen people with laptops, jet lag, and strong coffee opinions.
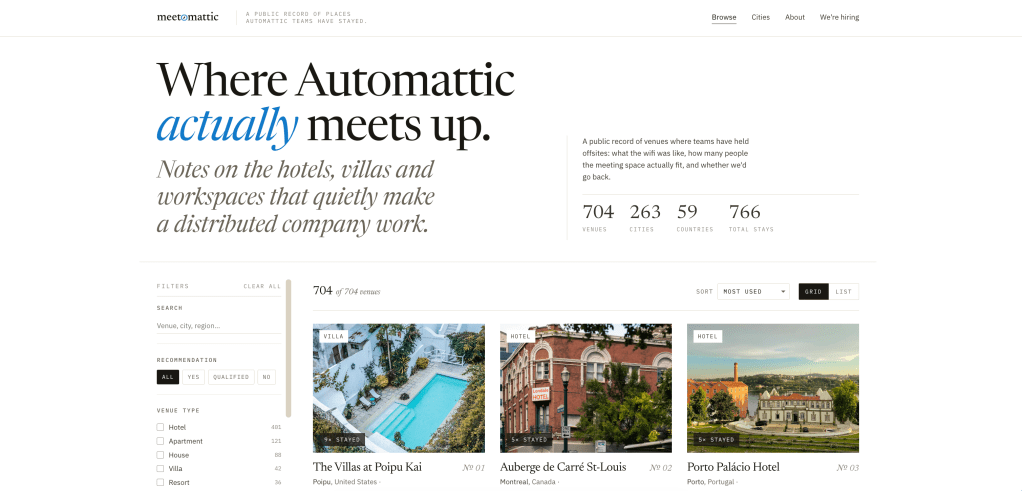
That list mostly lived in spreadsheets and our internal P2 system. I kept thinking it deserved a better home. So on the side, in evenings and weekends, I built one: meetomattic.com.
What it is
Meetomattic is a public directory of the venues Automattic teams have actually stayed in. Not aspirational listings, places we’ve booked, slept in, worked from, and would (or wouldn’t) book again. You can browse by city, see the venues, and read the kind of practical notes that only matter once you’ve tried to run a demo over patchy hotel Wi-Fi.
It’s small on purpose. No accounts, no booking engine, no affiliate links. Just a clean window into how one distributed company actually gathers in the physical world.
Why bother
This is a side project I’m tinkering with for fun. It isn’t going to move a metric. It probably won’t show up in a quarterly review. But distributed work is becoming more common, and the companies figuring it out are mostly figuring it out alone. Every team I talk to asks the same questions when they start planning their first meetup: Where do you go? What do you look for? What’s worth paying for (and what isn’t)?
We’ve been answering those questions internally for nearly two decades. It felt strange to keep the answers to ourselves.
What I hope happens
If a founder at a 15-person remote startup books a place from this list and their team comes home closer than they were before, that’s the win. If another distributed company publishes their own version and we can borrow ideas from each other, even better. The ambition is modest: Share what we’ve learned, lower the activation energy for in-person time at remote companies, and generate a little goodwill in a community that’s done a lot for us.
It’s a work in progress. Venues are still being added, photos are still being chased down, and I keep finding small things to polish. But it’s live, it’s real, and it’s ours to share.
Take a look: meetomattic.com. If you run a distributed team and end up booking somewhere from the list, I’d love to hear how it went.
Behind the Fiber-Optic Rope: Engineering WordCamp
7 May 2026, 2:00 pm
From time to time, our systems engineers write up a case study detailing a notable moment on the infrastructure front lines. The latest comes from Tyler Leeds, an Automattician on our Network Operations team, explaining how they ensure a rock-solid video stream from flagship WordCamp events.
Every year, Automattic sponsors and supports dozens of WordCamp meetups, where members of the WordPress open source community can connect in person, work collaboratively, and get updates on the software project’s latest developments. Of those many local and regional WordPress events, there are three (now four!) flagship events that mobilize the community at a national, regional, or continental level. WordCamp Asia, WordCamp EU, and WordCamp US—and starting in 2027, WordCamp India—bring together the best in our community. Not surprisingly, these flagship events require significant work to put together and manage. Local organizing committees don’t always have the resources of a company like Automattic, so we try to pitch in where we can.
I’ve recently returned home from WordCamp Asia in Mumbai, India. As we’re now preparing for WordCamp EU in Kraków, Poland, I thought I’d share a bit about what it takes to keep the tech flowing at a major conference. My purview extended to two key areas, Wi-Fi and streaming video, which I’ll discuss in turn.
Wi-Fi
If I were to design a challenge for a venue’s Wi-Fi system, I couldn’t dream up a better stress test than WordCamp Contributor Day. More than 1,400 community creators in a single room, all of them actively working on laptops? We’ve already seen the phenomenon cause failures at multiple WordCamp flagship events. So, in the leadup to this year’s WordCamp Asia, my network-engineering team was tasked with one simple mission: Make it go.
Science time: The 2.4Ghz spectrum that Wi-Fi uses also happens to be the same spectrum used by the magnetron in a microwave oven. Water absorbs the spectrum so effectively that it’s perfect for vibrating the molecules in a frozen pizza until they heat up. That absorption also means that Wi-Fi becomes extremely difficult in a room filled with humans moving around, and it’s even harder over its higher-frequency 5.8Ghz cousin. To a Wi-Fi network engineer, you’re all just mobile radio attenuators with a conference lanyard.
The limiting factor in large-scale events tends to be the availability of Wi-Fi frequency rather than a more common factor like upstream bandwidth. Imagine each channel in the Wi-Fi spectrum like a room filled with groups of people, all trying to have their own conversation with one person in each group. Eventually, too many people are all speaking at the same time and individual conversations fade into noise. The louder each person speaks, or the closer the groups, the more likely the noise from each group bleeds into the others and the conversations all collapse.
Good Wi-Fi systems design tries to keep the rooms small, the talkers quiet, and the groups as far from one another as possible.
At WordCamp Asia 2026, we had the pleasure to work with the Jio World Conference Centre in Mumbai. The JWCS already had the majority of work completed, with more than 100 access points in their Lotus ballroom, all managed by a controller-based wifi system.
Conferences are one of the areas where we’ve seen controller-based Wi-Fi environments sharply outperform controllerless (cloud-based) solutions. The reason here is simple: Controller-based solutions are able to more rapidly react to the changing RF conditions in the room as attenuators conference attendees move about, create mobile hotspots, and do whatever else they can to ruin our cleverly designed system. Cloud-based solutions typically sample the RF environment periodically through the day, and then do one or more daily optimization routines to manage the RF parameters of each access point. This is fine in an office or home, but in the rapidly shifting world of a conference, it tends to be too slow to be effective.
We’d been able to review engineering drawings and design briefs with the Jio team prior to the event, so went in with a reasonable degree of confidence that Wi-Fi would be stable. We limited users to 15Mbps to keep a lid on bandwidth, and implemented a “WordPress” SSID. The end result was a Wi-Fi environment that remained consistently good, even during the stress of contributor day.
A more interesting case, though, is what we’ve found while assisting the upcoming WordCamp EU organizers in Kraków.
The single most common Wi-Fi problem we encounter at venues is due to a misunderstanding by venue IT staff about the use of 20/40/80/160Mhz Wi-Fi channels.

We routinely encounter venues that have assigned 40Mhz channel widths to their 5Ghz spectrum. It’s understandable. 40Mhz channels roughly double the available bandwidth for each user, which sounds like a good thing, so most venue IT staff set it that way. The issue is that (to use our prior analogy) this creates fewer, larger groups that can much more rapidly overwhelm the conversation in the room. A much better solution in these environments is to break it up into the maximum number of 20Mhz channels in order to maximise usage of the very limited Wi-Fi spectrum, even if any given conversation has a limited bandwidth.
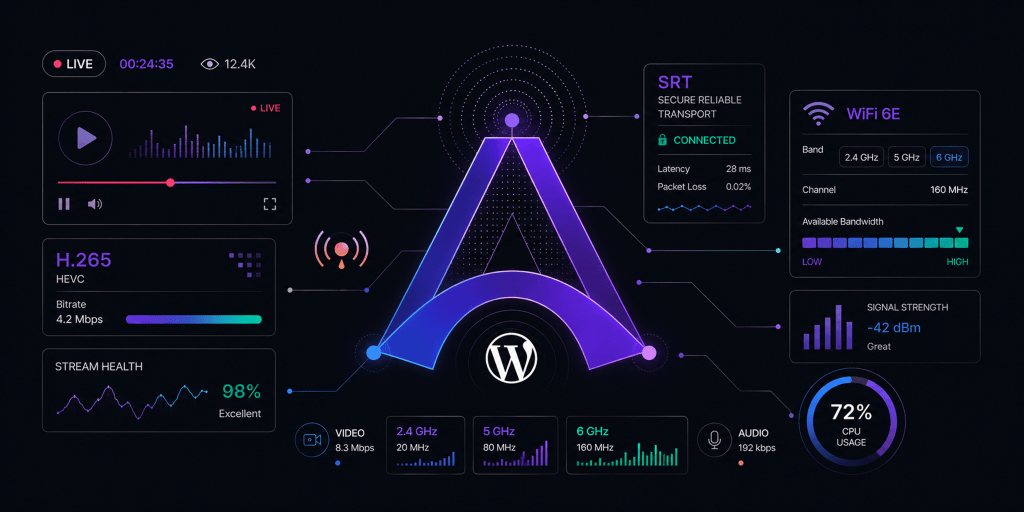
One of the actions we’ve been able to complete for WordCamp EU is a basic site survey of the venue, ICE Kraków. You’d be surprised how many venues are deployed without ever doing a site survey or attempting to optimize the RF environment, and you can see the results of that in the below image, an overlapping channel graph for the third floor of the complex. During the site survey, we found that many APs were running on 40 and 80Mhz channels. What makes this problem worse is that the co-channel interference caused by consuming too much RF airtime negates any possible throughput advantages you could have gained from running on 40 or 80Mhz channels in the first place. It’s very much a self-defeating problem.
Thankfully, the folks at ICE Krakow are enthusiastic about improving their Wi-Fi environment, so we also worked with them to locate bandwidth and throughput limitations in their Wi-Fi switching network, and have given recommendations and potentially equipment to solve them. We have every confidence the issues will be sorted well before the WCEU ever kicks off.
So, that’s Wi-Fi. On to the next issue that plagues network-ops teams.
Streaming
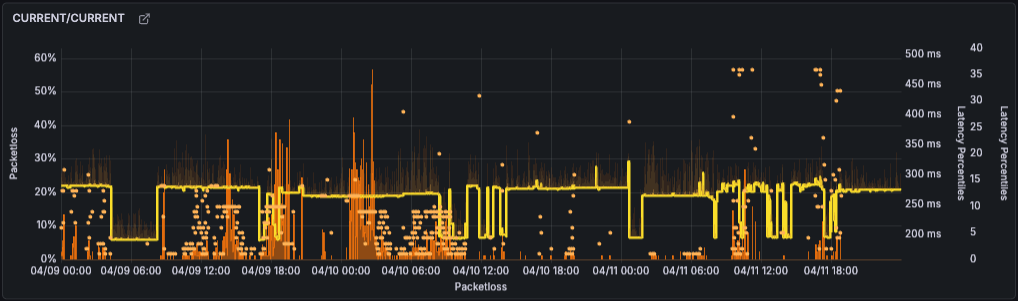
Over three days of activities at WordCamp Asia 2026, we enjoyed a successful live stream with very few issues, despite the event being hosted in Mumbai during a period of general internet degradation across India:
This wasn’t luck: After encountering some streaming issues during our CEO’s keynote at last year’s State of the Word, we had set out early to make sure we wouldn’t see a repeat occurrence at WordCamp Asia.
- Starting about six weeks before the event, we met with the venue’s internet provider to establish a baseline of connectivity—100Mbps synchronous, delivered over hard line—and discuss how this connectivity actually functioned in the real world.
- We extensively tested our streaming partner’s platform (Castr), and worked with our video and promotions teams to fully understand the backup options and understand the limitations and advantages of the various methodologies.
- We also completed pre-conference testing on video backup streaming. We quantified what a failover to our backup stream would look like to a viewer, what a switch back to primary entailed, and how to accomplish the switch in either direction.
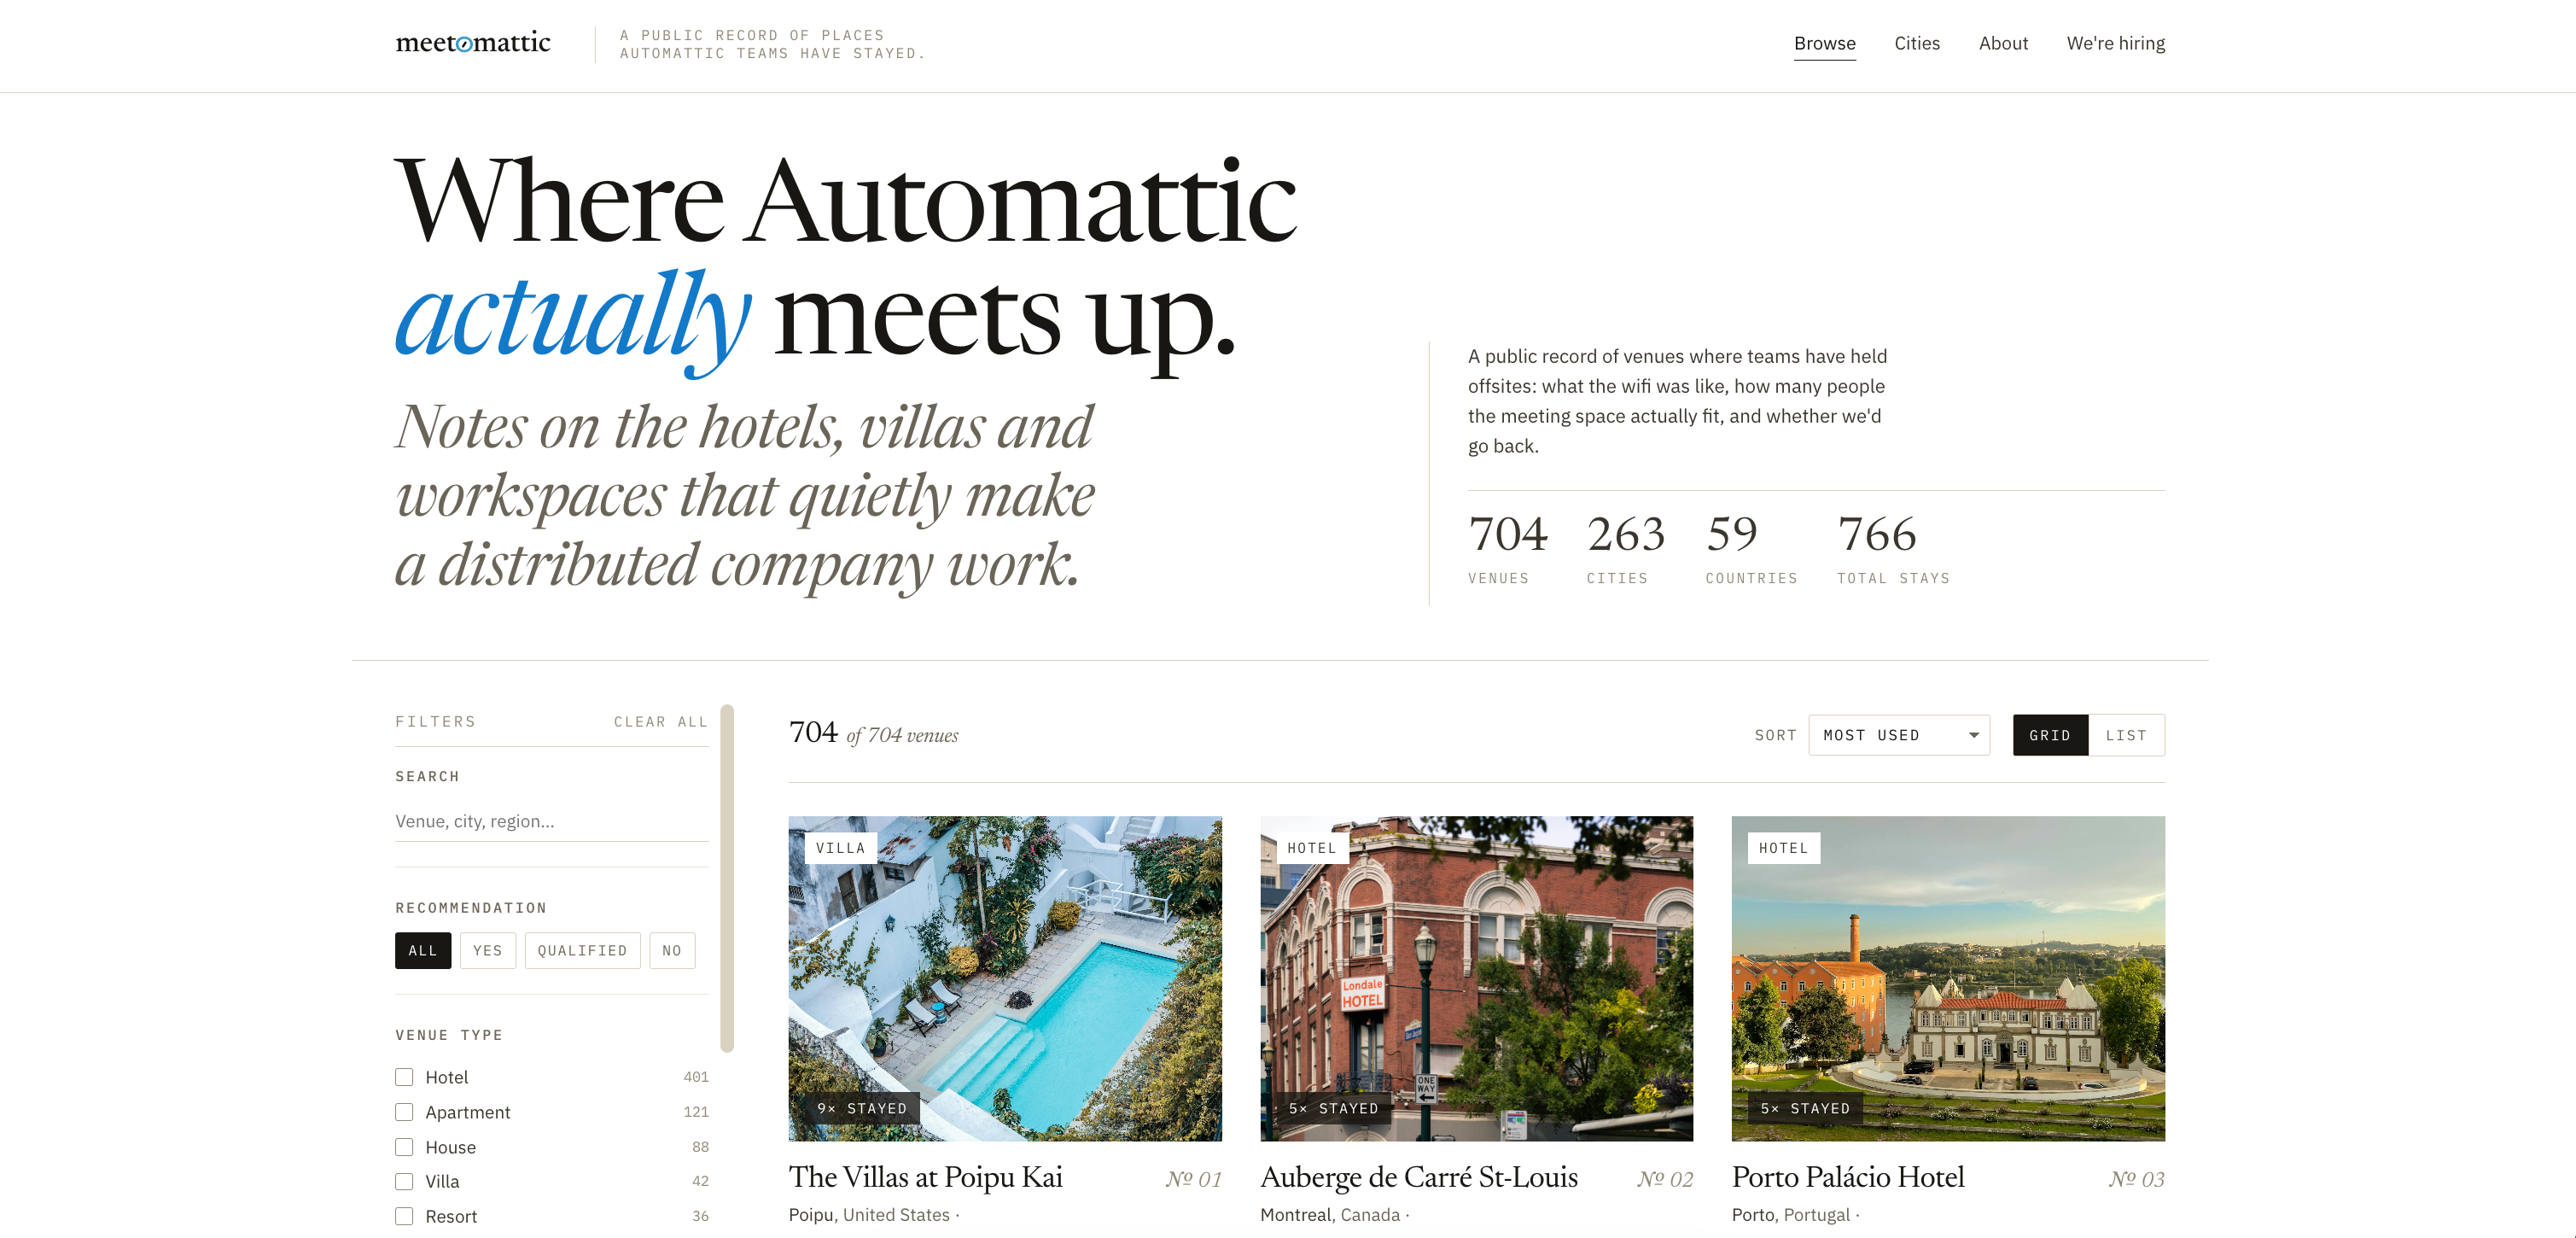
- We developed an explicit set of specifications for the video stream to protect against outright failure: H.265 HEVC with an SRT transport. (More on this decision later.)
- We created a failure action plan, which included articulating the set of conditions under which we’d execute a change to the backup encoder/ISP and when we’d switch back to primary once it stabilized.
- We coordinated with off-site colleagues to monitor the stream remotely and use a dedicated channel to report to on-site personnel; that way, we could ensure that what the world saw matched what we were sending from the venue.
- We documented the process to recreate a YouTube event in case of a stream failure, and discussed with all involved parties so that everyone was clear on their duties in such a scenario.
- Finally, we developed a comprehensive cheat-sheet that showed all the streaming destinations that would be required for the video production team to use with their encoders. We wanted to minimize any complexity the video production team would face backstage, so gave them a simple set of destinations and a simplified cue-sheet to prevent overburdening them with tasks during the show.
Technical Considerations
As mentioned, we settled on a stream spec of H.265 HEVC with an SRT transport. We set a minimum specification of a M3-based Mac computer to allow use of HEVC, the hardware encoder that’s built into the M series chips. In the end, we used M4 Mac Minis that performed solidly.
H.265 allowed us to use roughly half the bitrate required for high-quality 1080p streaming. A subjective quality assessment showed that H.265 at 4500kbps was visually equal to H.264 at 7000-8000kbps. This helped make stream issues due to bandwidth limitations less likely.
We moved to SRT (UDP-based) transport over RTMP (TCP-based) transport after observing that internet quality issues could cause the stream to disconnect from Castr, which would cascade into YouTube stream failures. SRT streams can progressively degrade quite strongly without disconnecting in situations that would have caused an RTMP failure.
Granted, the internet quality in India was sometimes variable, and so we experienced a few of these issues:
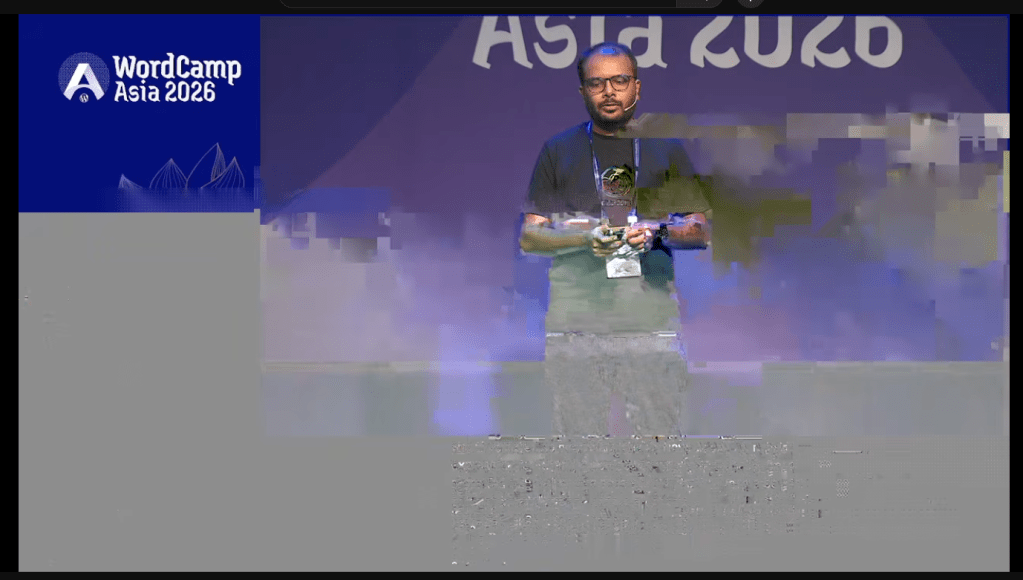
Even in these cases of video chunking, the audio remained coherent. The few times it occurred, we executed our backup failover plan for streams, and in all cases, the stream corrected immediately. We’d anticipated some level of stream degradation when we architected the backups, and we were rewarded by the smoothness of the results.
For my team, WordCamp Asia was a big win. The knowledge base we built during preparation was invaluable, and we’ll use it to inform future live streaming events like WordCamp EU. Even if the result was due to process engineering rather than technical wizardry, the outcome was the same: a solid stream that never went down.

How WordPress Sent a Dog (and a Pop Culture Brand) to the Moon
4 May 2026, 5:22 pm
Almost seven years ago, Brooke Hammerling’s girlfriends began texting her about Baby Yoda. They hadn’t watched The Mandalorian, but they’d seen the tiny creature popping up on social media and had become, in their own words, obsessed. The more Brooke explained about pop culture, and the more friends she explained pop culture to, the more she realized that she should consolidate all that explanation—and in late 2019, her newsletter Pop Culture Mondays was born.
PCM quickly grew into a full-fledged site that covered the trends, memes, and conversations that shape our digital lives. But as the audience expanded, she started hearing that her readers were frustrated with the look and design of the site. Enter WordPress, where flexibility and customization allowed Brooke to bring her vision to life. Now, PCM is a true extension of Brooke’s voice and perspective, from the videos she embeds to the images that star her dog Potato in situations drawn from that week’s stories. “There is nothing better on the market than WordPress’s AI generator,” she says of the tool that helps her concoct the images. “It’s remarkable.”
Today, the brand has expanded even further with her podcast, Pop Culture Mondays on Thursdays, which brings the same sharp perspective and commentary into a new format. Pop Culture Mondays stands as a testament to how a clear point of view, paired with the right tools, can grow into something uniquely your own. “Nobody has a site like mine,” she says. “Everybody on WordPress has a site that’s based on what they want, their experiences.” That holds true every day of the week.

WordPress: The Operating System of the Agentic Web
21 Apr 2026, 3:00 pm

We’ve invited executives from across Automattic to share their perspective on leadership, open source, and the future of the open web. The latest comes from James Grierson, our head of global expansion, who shared his thoughts on the WordPress’s crucial role in the agentic web. You can read the original post on James’s blog.
We’re entering a new era of the web. AI agents, autonomous tools that can create, manage, and optimize digital experiences, are no longer a concept deck or a demo at a conference. They’re here, they’re shipping, and they need a foundation to build on.
I think that foundation is WordPress.
Not because it’s trendy or new. But because it’s open, it’s massive, it’s battle-tested, and it was built on principles that turn out to be exactly what AI agents need to thrive.
Let me walk you through why I believe WordPress is uniquely positioned to become the operating system of the agentic web—and where the challenges still exist.
The Scale of the Ecosystem
Before we get into the argument, let’s ground ourselves in the numbers. WordPress currently powers approximately 43% of all websites on the internet and holds over 60% of the known CMS market. That alone makes it the most widely deployed content management platform on the planet.
But the real story is the ecosystem around it. I started working with WordPress in 2007, when I joined a startup hosting company called Bluehost. During my 10 years at the company, WordPress grew from one of the many CMS platforms available to a dominant player and became the CMS of choice for over 65% of new customers we brought to our hosting platform. During that period I also co-founded SimpleScripts, a remote installation app store for open source products before app stores were even cool. (SimpleScripts was acquired in 2010 and rolled into another product, so the website is only available on archive.org.) WordPress became the most popular application we installed and within a very short time frame reached tens of thousands of installations per month.
The official WordPress.org plugin directory contains over 61,000 free and open source plugins. When you include premium marketplaces and independent developers, the broader ecosystem exceeds 90,000 plugins. WooCommerce, WordPress’s commerce layer, adds another 1,200+ extensions that cover everything from payment gateways to subscription management to shipping logistics.
Almost every single one of these plugins is built on open source principles. (Not everyone respects the licenses, but what is open is available, and people have to make their own decisions). The code is available, reviewable, and extensible. That matters enormously when we start talking about AI agents.
Why Open Source Is the Secret Weapon
Here’s what I find interesting about the intersection of AI and open source: The very things that made WordPress successful as a human platform make it even more powerful as an agentic one.
AI agents learn from code. They analyze patterns, understand conventions, and build on what already exists. When that code is open and follows consistent standards, like the WordPress Coding Standards, the Plugin API, and the hook and filter system, agents can navigate it, understand it, and extend it with remarkable efficiency.
Think about it this way. An AI agent trying to build a feature on a proprietary, closed-source platform is essentially working in the dark. It can interact with an API, but it can’t see how that API is implemented, can’t learn from the patterns other developers have used, and can’t verify that the code it’s interacting with is secure or well-architected.
On WordPress, all of that is transparent. Every plugin in the directory has been reviewed against a set of guidelines. The code is peer-reviewed by the community. Security vulnerabilities are identified and patched in the open. WordPress itself follows a rigorous release cycle with dedicated security teams. This transparency gives AI agents something invaluable: a trustworthy, well-documented, standards-compliant codebase to learn from and build upon.
And with over 90,000 plugins to study, that’s an enormous dataset of real-world patterns, solutions, and approaches. More examples, more data, more context. All of which makes AI agents smarter and more capable when working within the ecosystem.
MCP: The Bridge Between AI and WordPress
The recent addition of Model Context Protocol (MCP) support is where things get super-exciting. MCP is an open protocol that standardizes how AI agents connect to and interact with external systems. WordPress.com introduced MCP support in October 2025, initially as read-only. By March 2026, full write capabilities were added, meaning AI agents like Claude, ChatGPT, and Cursor can now create posts, build pages, manage comments, organize content with tags and categories, and handle media—all through natural conversation, with human approval at every step.
That’s 19 writing abilities across six content types, available on all WordPress.com paid plans.
As a matter of fact, I used Claude Cowork connected via the WordPress.com MCP connection to work on this blog post. I provided all of the talking points and the information I wanted included, then worked together with my AI partner to create all of this content. It helped me to find the links for many of the topics discussed, and helped stage everything into a post in the WP-Admin in draft mode. I still hand-wrote many of the sections, but the overall process—writing, formatting, and publishing—took 75% less time than it might have otherwise.
For self-hosted WordPress, the WordPress MCP Adapter (part of the official AI Building Blocks initiative) bridges the Abilities API with the MCP protocol. If you already have plugins using the Abilities API, the MCP Adapter turns them into AI-ready APIs with very little additional work. Connect an MCP-aware AI client, and your WordPress site becomes an agentic platform.
This is not theoretical. I can now interact with existing sites, manage content, and build new experiences using AI agents connected through MCP. The barrier between “what AI can do” and “what a WordPress site can do” is rapidly disappearing.
The Pros: Why WordPress Is Built for the Agentic Web
Massive, proven ecosystem. Over 43% of the web runs on WordPress. AI agents building on WordPress are building on the most widely adopted CMS in the world, which means more compatibility, more integrations, and more reach.
Open source transparency. Every line of WordPress core, every plugin in the directory, every theme: it’s all open. AI agents can read, learn from, and extend this code. They can verify security, understand architecture, and follow established patterns. Closed platforms simply can’t offer this.
Peer-reviewed code and community standards. The WordPress plugin review process, coding standards, and security guidelines mean that agents are working with code that has been vetted by humans in accordance with a consistent, documented set of conventions. That consistency is gold for AI.
Security through transparency. Open source doesn’t mean less secure. It means more eyes on the code. Vulnerabilities are found faster, patches are shipped faster, and the entire community benefits. AI agents will accelerate this even further. I believe AI will soon be able to identify and fix vulnerabilities within code faster than manual reviews by humans could ever dream of. Having a massive open codebase to work with will only enhance those capabilities. Any argument that plugins are insecure falls apart when agents can find and patch vulnerabilities in real time.
The REST API and MCP connectivity. WordPress has had a robust REST API for years, giving external tools programmatic access to site content and functionality. With MCP now layered on top, AI agents have a standardized, secure way to interact with WordPress sites: reading content, creating posts, managing media, and more. This is the connective tissue that makes the agentic web possible.
WooCommerce and commerce extensibility. With 1,200+ extensions, WooCommerce gives AI agents access to the full stack of ecommerce operations: payments, shipping, subscriptions, inventory, analytics. An AI agent managing a WooCommerce store has a rich set of tools already built and ready to be orchestrated.
The hook and filter architecture. WordPress’s event-driven architecture (actions and filters) is actually a fantastic pattern for AI agents. It’s modular, predictable, and well-documented. An agent can hook into specific points in the WordPress lifecycle without needing to understand or modify the entire system. This is extensibility by design.
WordPress Playground for safe experimentation. The WordPress Playground project lets AI agents spin up full WordPress instances in seconds for testing and iteration. Agents can build, test, break things, and try again, all without touching a production site. This kind of safe sandbox is essential for agentic development.
Decades of documentation and community knowledge. WordPress has been around since 2003. The volume of documentation, tutorials, Stack Exchange answers, forum posts, and blog articles about WordPress development is staggering. This is the training data that makes AI agents effective, and no other CMS comes close to matching it.
The Cons: Challenges to Acknowledge
Legacy code and technical debt. WordPress is over 20 years old. Some parts of the codebase carry patterns and conventions from a very different era of web development. AI agents navigating older areas of core or long-unmaintained plugins will encounter inconsistencies and outdated approaches that can lead to confusion or sub-optimal output.
Plugin quality is inconsistent. While the official directory has review guidelines, the quality bar varies significantly across 61,000+ plugins. Not every plugin follows best practices, and some are poorly maintained or abandoned. AI agents working with third-party plugins need to be able to distinguish between well-built and poorly-built code, and that’s not always straightforward.
Abandoned and insecure plugins. The sheer size of the ecosystem means there are plugins that haven’t been updated in years and may contain known vulnerabilities. An AI agent that blindly integrates or extends an abandoned plugin could introduce security risks. Curation and quality signals will be important so that agents to know what constitutes a good or bad plugin.
Performance overhead. WordPress’s flexibility comes with a cost. The hook system, database queries, and plugin loading can introduce performance overhead, especially on sites with many active plugins. AI agents building on WordPress need to be mindful of performance implications, not just functionality. This also brings in some unique questions as to whether AI will be able to dive in and resolve some of these performance issues and solve them on a larger scale. I believe this will change rapidly as the community works together to provide data and improve performance overall.
The complexity of the hook system for agents. While the hook and filter architecture is powerful, it can also be complex. Understanding the order of execution, priority levels, and interactions between multiple plugins hooking into the same actions requires nuanced understanding. AI agents are getting better at this, but it remains a non-trivial challenge. Again, time and code will make this improve considerably.
PHP perception and talent pipeline. WordPress is built on PHP, which carries a perception problem in some developer communities. While PHP has evolved significantly (PHP 8.x is a modern, performant language), some AI-focused developers and companies default to Python or JavaScript ecosystems. This perception gap could slow adoption of WordPress as an agentic platform. Also, if you look at the massive scale and concurrent users of major websites using WordPress and PHP, it is still highly performant when done right. Just ask any of our high-traffic WordPress VIP customers.
Fragmentation across hosting environments. WordPress runs on everything from a personal computer in someone’s home to a shared hosting company, all the way to enterprise cloud infrastructure. This diversity means AI agents can’t assume a consistent server environment with set system resources—which adds complexity to deployment, testing, and optimization.
Where This Is Heading
The convergence of WordPress’s open ecosystem with AI agent capabilities is not a small thing. We’re looking at a platform that powers nearly half the web, backed by an open codebase with decades of community knowledge, now connected to AI agents through standardized protocols like MCP.
The cons may be real, but they’re also largely solvable. AI agents themselves can help clean up legacy code, identify insecure plugins, optimize performance, and enforce coding standards. The very challenges WordPress faces are the kinds of problems AI is exceptionally good at solving.
What we’re seeing, I think, is the beginning of a virtuous cycle. WordPress gives AI agents a massive, transparent, standards-compliant foundation to build on; AI agents, in turn, make WordPress more secure, more performant, and more capable. More plugins get built, more patterns get established, more data becomes available, and the whole ecosystem gets stronger.
I remember speaking with WordPress co-founder and Automattic CEO Matt Mullenweg back in 2017, when I was new to Automattic. We were sitting together outside in the Bay Area, preparing for a partnership meeting, and Matt shared with me his long-term vision of WordPress becoming the language of the open web. That’s stuck with me throughout the years. WordPress wasn’t initially designed to be the operating system of the agentic web, but the principles it was built on—openness, extensibility, community, and standards—turn out to be exactly what this moment requires.
The foundation is already here. Now let’s build on it.

The One Thing That Changed How I Work
6 Apr 2026, 12:00 pm
We’ve invited executives from across Automattic to share their perspective on leadership. The latest comes from Paolo Belcastro, Artistic Director for Automattic’s Domains Maison, who shared a thoughtful piece about what he learned from coaching. You can read the original post on Paolo’s newsletter.
I didn’t come to leadership through a business school. I learned by building teams, shipping work, and making plenty of mistakes in a fully distributed environment.
That’s why, a few years in, Automattic’s CFO asked me a simple question: “How could the company help your development?”
Going back for a formal program sounded great in theory and impossible in practice. I was working full‑time; there was no realistic way to disappear for months into classes and case studies.
So, we landed on something that would fit the work: coaching.
I had never done it and was really curious. I never thought it would change the trajectory of my career.
I found a coach in Vienna and we met regularly for about a year—roughly twenty sessions, almost every other week. (Automattic covered a block of sessions, which made it easy to start.)
Remote work wasn’t mainstream yet, so an amusing amount of our early time went into me explaining how a distributed company actually runs. In other words, my first coaching win was … onboarding my coach. Once we got past that, the value was immediate. Coaching didn’t instill new skills; it pulled out what I already knew, revealed blind spots, and turned intention into action. The following year, we kept three or four check‑ins, then closed that chapter.
Then, in 2017, Automattic launched a structured coaching program. That was a real unlock. Coaches were pre‑vetted and already fluent in our context—remote work, async decision‑making, written culture—so we could spend the full hour on outcomes instead of explaining how Slack threads work.
The next year, after a short sabbatical, I chose one coach from the program and worked intensely with him through five or six cycles. Each cycle ran six to eight months and followed a similar path: set a few objectives → do the work → measure → reset. These weren’t six years on the same topic; every cycle focused on different goals, and we kept moving the baseline forward. That cadence—clear goals, real work, honest measurement, reset—became the operating rhythm I still rely on.
By the end of 2024, that coach gave me a piece of feedback I appreciated: we were approaching mutual‑coaching territory. Not because everything was “done,” but because our conversations had become too familiar. To push further, I needed a different perspective.
So, in 2025, I switched to a coach with hands‑on experience in my exact role. Since then, the mode alternates deliberately: coaching when I need clarity (he draws answers out of me) and teaching when a proven method exists (we instill it and move on).
So, I guess I have some experience in coaching (more than 10 years at this point!).
There are a few practices that stuck with me:
- Work in cycles (6–8 months). Few goals, clear measures, reset.
- Pick the mode on purpose. Coaching for clarity; teaching for repeatability; and, when the knot is human rather than technical, counseling‑style reflection so the work can proceed.
- Choose fit over prestige. There’s no universal “best coach”; there’s only the right one for your role and season.
I’m grateful Automattic invests in this. And I’ll repeat the simple lesson I’ve learned since 2014: Nobody serious operates alone. Ask for help, pay for it when needed, and change the kind of help as your season changes.
“One For My Baby”
11 Mar 2026, 11:25 am
When a baby arrives early, time becomes the most important thing a family has. For Manzoor Ahmad, a code wrangler on Automattic’s Triforce team, paid parental leave meant time to care for his wife, support his newborn son through a difficult start, and focus on his family without the added pressure of work or lost income.
Manzoor and his wife were expecting their first child near the end of July, but the pregnancy became complicated much earlier. “During the sixth month, we started experiencing problems, having frequent hospital visits,” he said. “Automattic was very supportive and our team lead was as well.”
A family in crisis
At 32 weeks, the situation became urgent, and Manzoor’s wife had to undergo an emergency C-section on June 6. Their son was born weighing 1.4 kilograms—“a tiny creature,” in Manzoor’s words.
In the weeks and months that followed, his care required close attention and constant effort at home. Manzoor said he and his wife alternated “skin to skin” care, and because the baby was too weak to nurse, they had to feed him by spoon for four months. Fortunately, “since I had the parental leave, I could focus completely on my wife and child,” he said.
Support when it’s most needed
That time away from work made an immediate difference. “I had to start my parental leave immediately, so I dropped a note to my HR wrangler,” Manzoor said. “A huge burden lifted off my chest. I could take care of my wife.” He described the relief in simple terms: “Not caring about my work during those days was a huge relief.”

The support extended beyond schedule flexibility. Because his leave was fully paid, he said the family did not have to take on another source of stress while caring for their son. That stability helped Manzoor stay present through his wife’s recovery and the long routine of feeding and monitoring a premature newborn.
He also remembered the practical care that filled those months. “I could cook for my wife without any time constraints and make sure that she recovered and wasn’t getting stressed by all the hassle we went through,” he said. By the end of three months, his baby’s weight had reached three kilograms, and Manzoor returned to work.
Automattic provides six months of parental leave, so Manzoor was able to split his leave in two sections, giving him the flexibility he needed to take care of his family: “Then at six months I went on three more months of parental leave, and we had a vacation with my wife, the baby, and my parents.”
Real families, real life
Stories like Manzoor’s show how leave policies affect real families in real moments, especially when life does not follow a plan. In this case, paid time away from work created room for care, recovery, and financial stability during a medical crisis that began months before the baby’s due date. It also offered something harder to measure but easy to understand: peace of mind.
Learn more about Automattic’s employee benefits. And if our mission appeals to you, check out our open jobs and consider joining us.

(Almost) No Downtime MariaDB Upgrades
6 Mar 2026, 6:14 pm
From time to time, our systems engineers write up a case study detailing a notable moment on the infrastructure front lines. The latest comes from Andrija Vucinic, an Automattician on our Systems Operations team, who is upgrading our fleet of database servers to MariaDB 11.8.
We’ve been running MariaDB since version 10.0.13, which was released around 12 years ago. With the recent improvements to the query optimizer, addition of online ALTER queries and support for vectors it was about time we upgraded our fleet of servers, some of which were still on 10.1… The server count today is 1,789, running various MariaDB versions. We started upgrading the servers to 11.4, but are planning to get all on 11.8.
We don’t run any multi-master deployments. One primary, and various # of replicas, depending on the service. The most common deployment is 1 primary + 2/3 replicas in origin DCs + 1 backup host.
Preparing hosts for upgrades in most cases is fairly easy for us. I would say there are 2 major cases: services which only connect to the local instance (e.g. DNS servers, edge servers…) and services that connect to many databases.
For the many-databases case we use HyperDB for WordPress. HyperDB is an advanced database class that supports replication, failover, load balancing, and partitioning. We can either update the configs to exclude the hosts we’re upgrading, or we can upgrade in-place if the upgrades are fast as HyperDB will just failover while the server is being restarted.
The local instance servers in most cases are behind anycast, so we just have to withdraw the routes. For the rare other cases it is configurable via config files.
And of course… backups! But makes sure they are working. Have you tried?
Persistent AUTO_INCREMENT for InnoDB
MDEV-6076 (Fixed in 10.2.4)
We tried to upgrade the less critical services first. We run community fork of Phrabricator called Phorge. It’s like GitHub, but open-source and with support for svn which we still use a lot. The DB was on 10.1, and I decided to go straight to 11.4. Upgrading the secondaries was (as always) pretty smooth. Then I upgraded the primary in-place.
Just a few notes in the logs:
...
2025-07-31 17:39:51 426575 [Note] InnoDB: Resetting PAGE_ROOT_AUTO_INC from 411 to 1244743 on table `phabricator_audit`.`audit_transaction` (created with version 50534)
...
That seemed to work as expected. But the Web UI was reporting a lot of errors. And as it often happens, the errors aren’t easy to read. After manually adding some more error logging to surface the database errors:
Duplicate entry '...' for key 'PRIMARY'
With the PAGE_ROOT_AUTO_INC resets I was fairly certain what it could be. Wrote a bash script to check and fix:
#!/bin/bashINSTANCE=$( ls /etc/mysql/mysql* | cut -d / -f 4 | sed 's/\.cnf$//' )DB=$($MYSQL --defaults-file=/etc/mysql/${INSTANCE}.cnf -N -e "SELECT UNIQUE(table_schema) FROM INFORMATION_SCHEMA.TABLES");for db in $DB; do for table in $($MYSQL --defaults-file=/etc/mysql/${INSTANCE}.cnf -N -e "SELECT table_name FROM INFORMATION_SCHEMA.TABLES WHERE TABLE_SCHEMA = '$db'"); do # Grab current auto increment from table info TABLE_AC=$($MYSQL --defaults-file=/etc/mysql/${INSTANCE}.cnf -N -e "SELECT AUTO_INCREMENT FROM INFORMATION_SCHEMA.TABLES WHERE TABLE_SCHEMA = '$db' AND TABLE_NAME='$table'") if [ $TABLE_AC == "NULL" ]; then continue fi # Grab the auto increment column. There can be only 1 PK with AC. PRIMARY_AC_COLUMN=$($MYSQL --defaults-file=/etc/mysql/${INSTANCE}.cnf -N -e "SELECT COLUMN_NAME FROM INFORMATION_SCHEMA.COLUMNS WHERE TABLE_SCHEMA = '$db' AND TABLE_NAME = '$table' AND COLUMN_KEY = 'PRI' AND EXTRA LIKE '%auto_increment%'") if [ -z "$PRIMARY_AC_COLUMN" ]; then echo "$db.$table couldn't find primary key" continue fi # Actual MAX($PRIMARY_KEY) MAX=$($MYSQL --defaults-file=/etc/mysql/${INSTANCE}.cnf -N -e "SELECT MAX($PRIMARY_AC_COLUMN) FROM \`$db\`.\`$table\`") if [ $MAX == "NULL" ]; then continue fi # All fine if table info AC larger than MAX($PRIMARY_KEY) if [ $TABLE_AC -gt $MAX ]; then continue fi NEW_AC=$((MAX+1)) echo "$db.$table auto increment mismatch: [current: $TABLE_AC] [MAX($PRIMARY_AC_COLUMN): $MAX]. Updating to $NEW_AC" $MYSQL --defaults-file=/etc/mysql/${INSTANCE}.cnf -N -e "ALTER TABLE \`$db\`.\`$table\` AUTO_INCREMENT = $NEW_AC, ALGORITHM=INSTANT" donedone
I was a bit surprised to find ~10% of the tables had auto-increment reset to 0.
While changing the auto-increment should be just a metadata change, in weird rare cases of very old tables MariaDB decides to do a table rebuild. And we all know how bad a long running ALTER table is. In our case, HyperDB tries to use non-lagging hosts, which in this case would only be the primary server. While it might survive the load spike, we’d rather not have such tests in production.
That’s where ALGORITHM=INSTANT comes into play (which I added later). If it’s planning to do a table rebuild, it will fail.
The case where I caught the rebuild was on 200GB+ table. I just crafted a bogus INSERT INTO to bump the auto-increment and was done with it.
Opening all .ibd files on InnoDB startup can be slow
MDEV-32027 (Fixed in 10.6.17, 10.11.7, 11.0.5, 11.1.4, 11.2.3, 11.3.2)
This one made us really happy… While not an upgrade problem directly, it showcases some specifics with our deployment. What’s the highest # of tables in a single database you’ve worked with?
db-host:/var/lib/mysql# find . -type f -name "*.ibd" | wc -l
5316915
Not sure there are too many cases similar to ours here, but we have a lot of instances with 5 million+ tables. On ext4 we also had to increase the number of inodes by setting bytes-per-inode to 8KB to fit this many files.
db-host:~# df -i
Filesystem                Inodes     IUsed    IFree IUse% Mounted on
...
/dev/mapper/crypt-root 233568256 152168294 81399962   66% /
...
This made server restarts for instances with InnoDB tables quite long. For this specific instance MariaDB 10.4.32 took ~6 minutes to restart.
2026-01-27 16:46:38 0 [Note] Starting MariaDB 10.4.32-MariaDB-log source revision c4143f909528e3fab0677a28631d10389354c491 as process 212645
2026-01-27 16:52:29 0 [Note] /usr/local/mariadb10.4/bin/mysqld: ready for connections.
After upgrade to MariaDB 11.8.5 it takes ~50 seconds.
2026-02-19 16:18:53 0 [Note] Starting MariaDB 11.8.5-MariaDB-log source revision a74edc42d080a73e20d5d94e1dd5beea400b507c server_uid iGwvQxgUodxkER0AgD5iMnvSkgM= as process 2053034
2026-02-19 16:19:42 0 [Note] /usr/local/mariadb11.8/bin/mariadbd: ready for connections.
Old data formats (temporal and decimal)
While we don’t run MySQL 4.0 anymore, some of the tables were created quite a long time ago. Like 21 years ago.
`date_registered` datetime /* mariadb-5.3 */ NOT NULL DEFAULT '0000-00-00 00:00:00',
`amount` decimal(5,2) /*old*/ NOT NULL DEFAULT '0.00',
There were changes to the internal representations of decimal and temporal formats. This isn’t a problem per-se, but we decided to get it updated as part of the “big upgrade”. There are multiple reasons why to do this:
DATETIMEformat down to 5 bytes from 8 bytes. Can also store fractional seconds (+3 bytes if defined as such).DECIMALformat halved storage requirement and changed from ASCII to packed binary. This also improves the speed of any arithmetic operations over the data. New format also enforces definition limit.
For the temporal types rebuilding the table is enough. We usually rebuild the replicas first, or if the replicas need upgrading we update the backup and restore from it.
The decimal one had a surprise… DECIMAL(5,2) should be -999 to 999. Nope.
MariaDB [wpmu-global]> SELECT ID, amount FROM store_paypal_transactions WHERE ID = 49417097;
+----------+---------+
| ID       | amount  |
+----------+---------+
| 49234097 | 1675.00 |
+----------+---------+
Found it while trying to switch a DATETIME column in an old table that also had DECIMAL. The rebuild was failing because it couldn’t store the values already in the table. Had to increase to DECIMAL(8,2) to fit all the values already in the table. This is a huge table, so we use tools like pt-online-schema-change to do such changes in production.
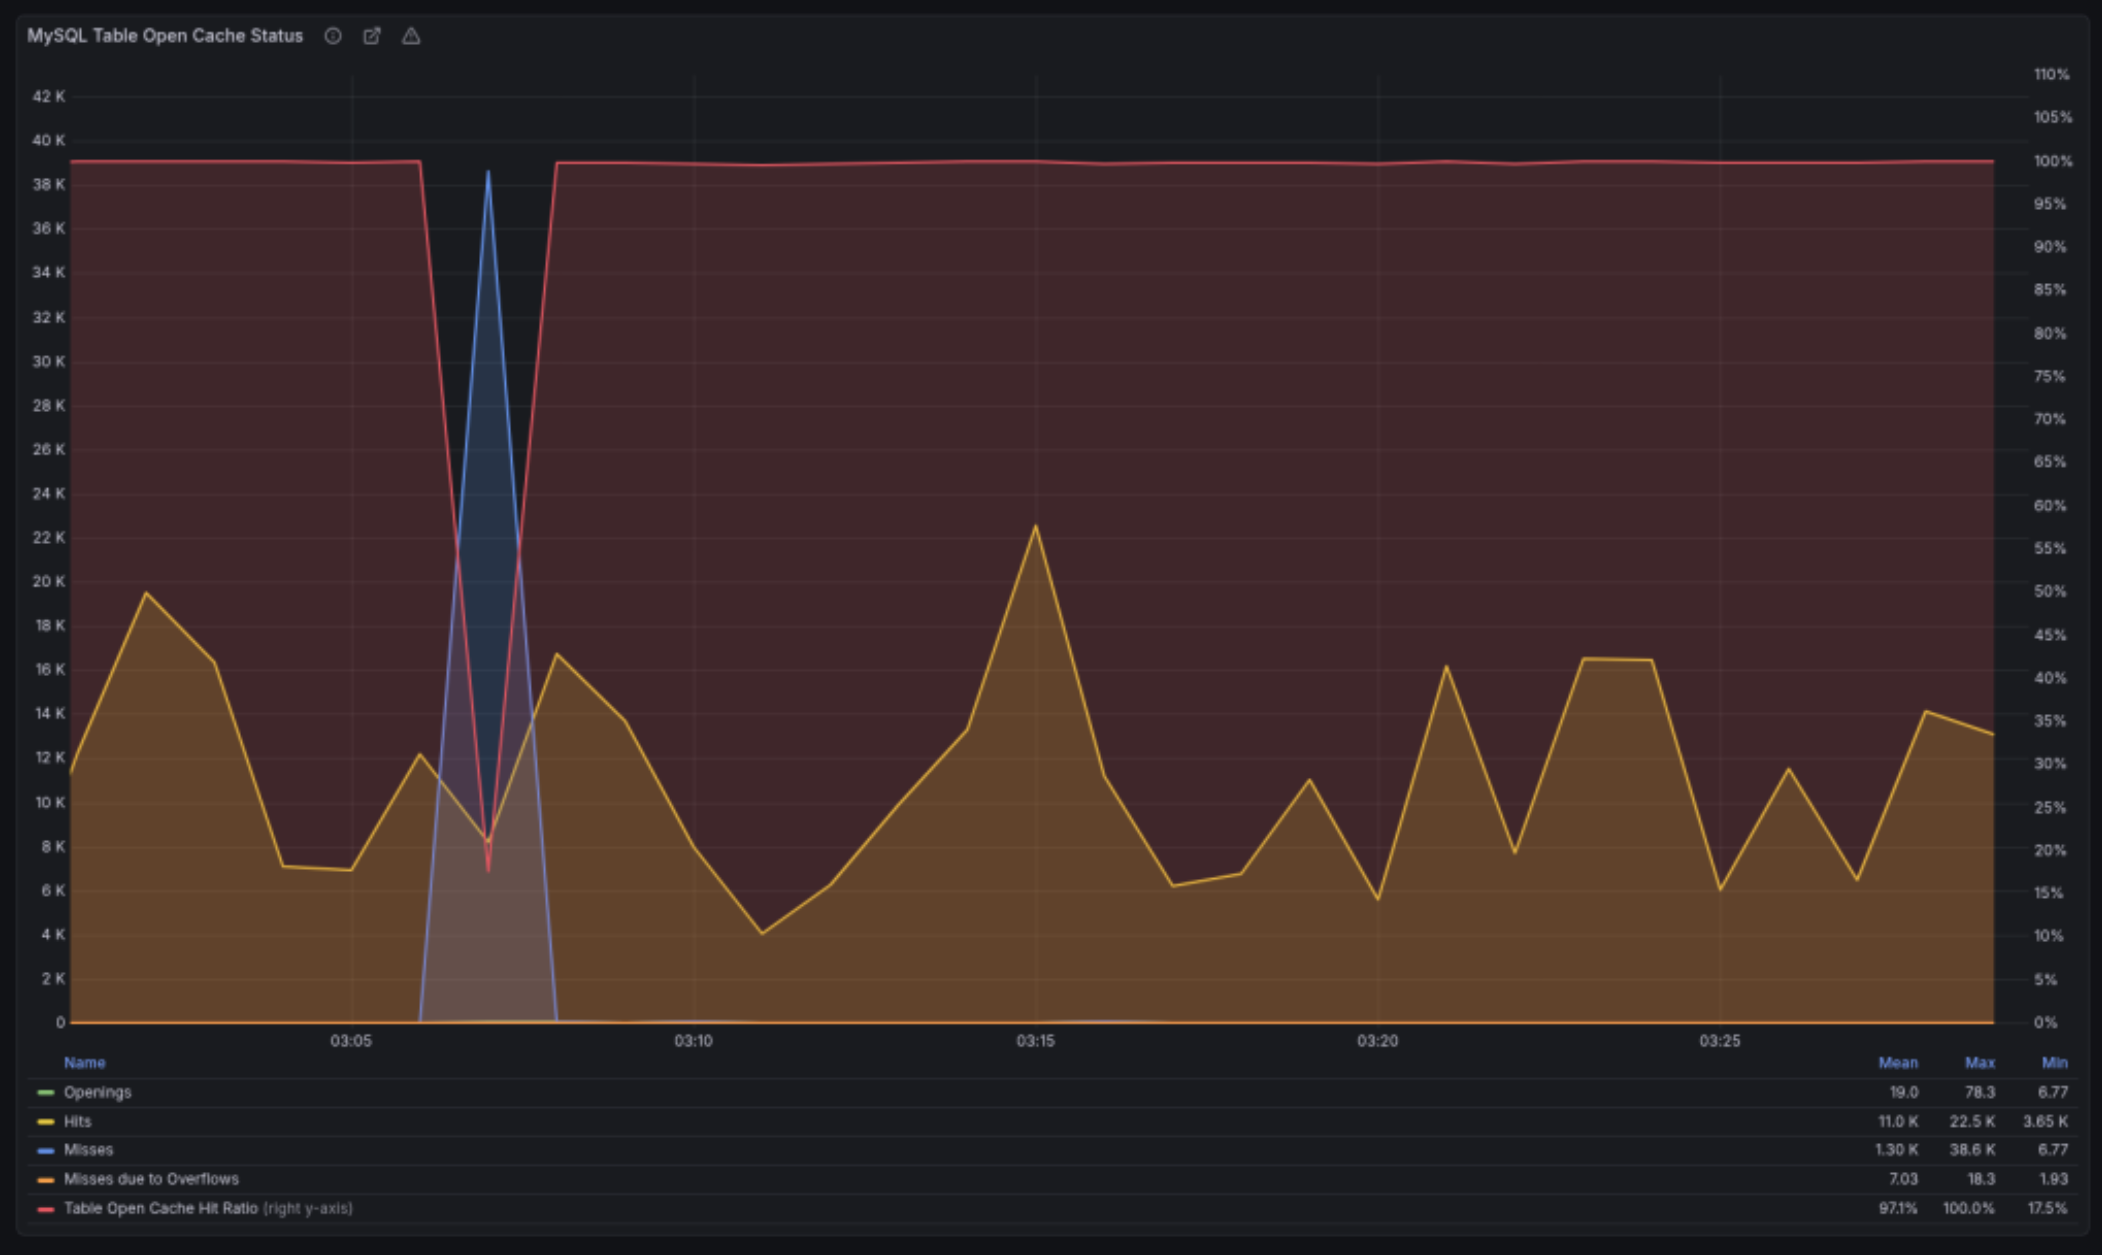
Multi-instance table cache
MDEV-10296 (Fixed in 10.2.2)
We run the servers with:
table_open_cache=10000
Prior to 10.2.2, you could have only a single cache instance.
2025-12-06 13:41:34 363177928 [Note] Detected table cache mutex contention at instance 1: 20% waits. Additional table cache instance activated. Number of instances after activation: 2.

The new version added a parameter table_open_cache_instances which defaults to 8. After upgrading, we would get weird stalls when MariaDB becomes unresponsive for a minute or two when the new instance gets activated. We reverted to the old behavior for the time being:
table_open_cache_instances=1
Planning to debug once all upgrades are done.
Change default charset from latin1 to utf8mb4
MDEV-19123 (Changed in 11.6.0)
I completely overlooked this one. You know how we all sometimes assume stuff “magically” works… We’ve been running latin1 since forever. I upgraded only a single host to 11.8 in order to test, and it made the whole thing harder to debug.

So when someone mentioned garbled translations, it took me a while to figure out why. We route queries based on the web server location, so had to trace the actual requests to find which database server they were hitting. Once it was localized to the 11.8 instance, it was clear what it was.
HyperDB allows us to set charset and collation per server but we never explicitly set them and were relying on defaults, which is why it broke. The data was latin1 but the server converts latin1 -> utf8mb4 on the way out. Updated to latin1 / latin1_swedish_ci to fix.
The Curious Case of the Crashing Server
This was a database for an asynchronous job system. Here hundreds of workers claim and report job statuses. In terms of QPS (queries-per-second) it’s averaging ~7000.
It was working fine on 10.1. Or at least it didn’t break. Driven by my previous good experience, I went straight to 11.4 here. And it was a disaster. It would break a few times a week, and the only way to restore it to a working state was a restart. It drove us nuts.
Testing here was also harder, because while we have replicas they don’t get any traffic. They exist as failovers if the primary becomes unavailable due to unforeseen circumstances.
So we started digging through the changelogs, but nothing really stuck out. We tried different InnoDB options. We upgraded the OS to trixie (we’re running Debian on 99.99% of our servers). Looked at perf and strace. Downgraded the DB back to 10.4, as it crashed the least on this one… Tried some kernel options, even upgraded the server firmware, but nothing really helped us until:
thread_handling=pool-of-threads
This option has existed in MariaDB since 5.5.21, but we never really looked it up. It’s perfect for the job DBs.
Thread pools are most efficient in situations where queries are relatively short and the load is CPU-bound, such as in OLTP workloads.
We got less spiky thread behavior:

Which resulted in stable QPS (notice the difference in dips):
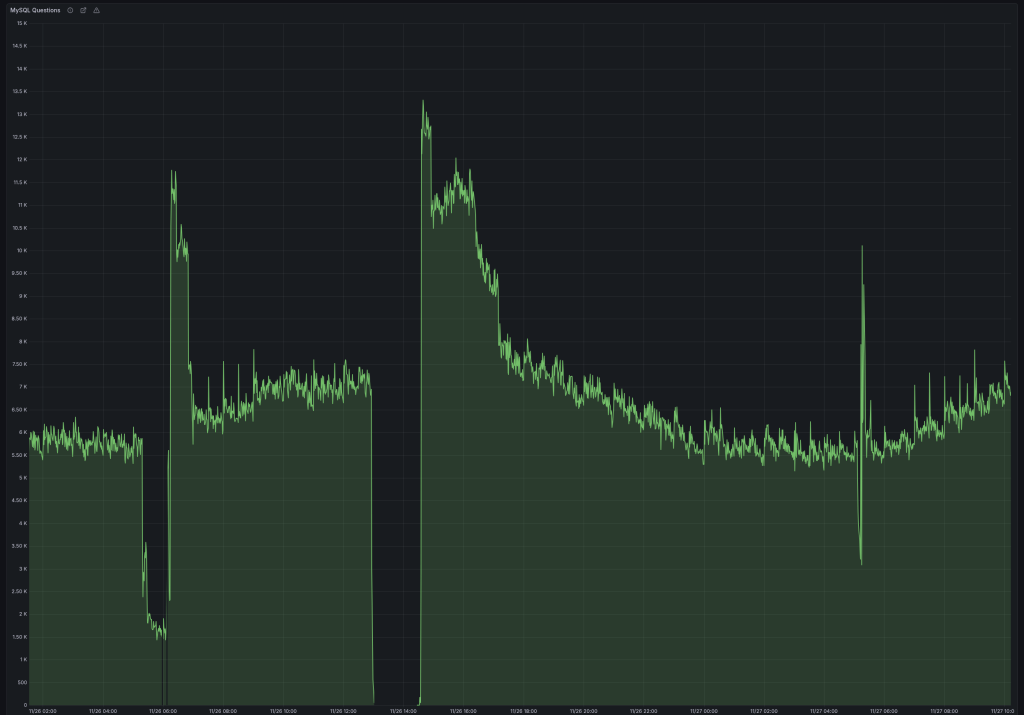
And I/O utilization went down from 40% to 10%. I was sure it was finally fixed.

Until it crashed again, but this time after a week. At this point we decided to take a wider look. It might not be MariaDB. Enabled the slow log and started fixing queries running > 1 second.
The first step was adding a compound index over 4 fields which covers almost all queries we run. Previously it didn’t include the updated field.
KEY `idx_index_name_state_updated_blog_id` (`index_name`,`state`,`updated`,`blog_id`).
This got us down to a single slow problem query, which was running close to 60 minutes:
SELECT es_indexable_sites_id FROM es_indexable_sites WHERE index_name = 'global' AND state NOT IN ('inactive', 'permanently-active') AND updated < '2025-10-10 00:00:00' LIMIT 250;
There’s definitely an index to use, let’s check what it’s doing:
  select_type: SIMPLE
        table: es_indexable_sites
         type: range
possible_keys: index_name_updated,idx_index_name_state_updated_blog_id
          key: idx_index_name_state_updated_blog_id
      key_len: 132
         rows: 29052898
        Extra: Using where; Using index
Funny right, going through 29 million rows with an index? That’s how NOT IN works. It has to scan all rows skipping those that aren’t in the wanted state until it gathers 250 as requested. And in most cases there are less than 10 such rows, so it would scan the whole table every time it ran that query, which was once per day. This is a 52GB table.
But our state has only 4 values. Rewriting the query with state IN ('active', 'active-query') gives us a very different EXPLAIN:
  select_type: SIMPLE
        table: es_indexable_sites
         type: range
possible_keys: index_name_updated,idx_index_name_state_updated_blog_id
          key: idx_index_name_state_updated_blog_id
      key_len: 137
         rows: 2
        Extra: Using where; Using index
While it didn’t crash the database, it would drop the QPS to less than 1000, and would never recover unless restarted. We didn’t really figure out why, and we briefly discussed it at the MariaDB Day 2026 in Brussels during FOSDEM, but don’t have an answer as to why it would degrade the performance so badly.
After fixing the query, we upgraded the server to 11.8 and it’s been running stable ever since.
Performance Overview
For our workload this was the general rule: 10.1 < 10.4 < 10.11 == 11.4 == 11.8.
It’s important to have the same configuration before and after (since defaults often change). Also mind the cache when testing. Whether it’s filesystem cache for MyISAM or InnoDB buffer, I’d suggest testing both cold and warm caches to make sure there’s no performance degradations.
Here’s some actual data from the 5+ million tables servers from above. The breakdown is in seconds (collected from Query Response Time MariaDB plugin, and displayed in Grafana).
MyISAM
10.4

11.8

For queries running under-or-equal to 1 millisecond: v10.4 – 86.45% vs v11.8 – 86.74%. This is expected as MariaDB has switched to the Aria engine (crash safe MyISAM) since v5.1, and I don’t think much time has been spent on improving MyISAM. I’m planning to test a few hosts, but that’s for another post.
InnoDB
10.4

11.8

For queries running under-or-equal to 1 millisecond: v10.4 – 95.35% vs v11.8 – 96.83%. That’s a 1.5% difference, with a shift of 10% more queries in the 0.1 millisecond bucket which is quite a nice change. Median query runtime improved from 0.075 ms to 0.067 ms (~10%).
Conclusion
The problems we had:
- 1 major issue with resetting auto-increments (if you’re coming from <10.2)
- 2 default parameter changes (although the
latin1->utf8is major, it’s easy to set back the default to what it was before) - and 1 server crashing (for which we take half the responsibility, because even if it was working on 10.1 there was a query that became bad over time)
Quite minor, as we caught the auto-increment problem on a non-critical server, and it was easy to fix by just running the fixer script after upgrades from 10.1.
The good stuff? Harder to list but:
- faster query execution on InnoDB
- online ALTER TABLE queries
- faster server restarts
- support for vector search
- and many others, but you’ll have to read the changesets starting from 10.1
Can you upgrade 10.1 -> 11.8?
TL;DR: Yes! But…
Always test in a safe environment you can easily revert if it stats breaking. There’s only 10 years of updates between the first releases of 10.1 and 11.8.
Page processed in 0.353 seconds.